Candle Behaviour
How candlesticks form, what OHLC represents, and what the idea of Power of 3 means.
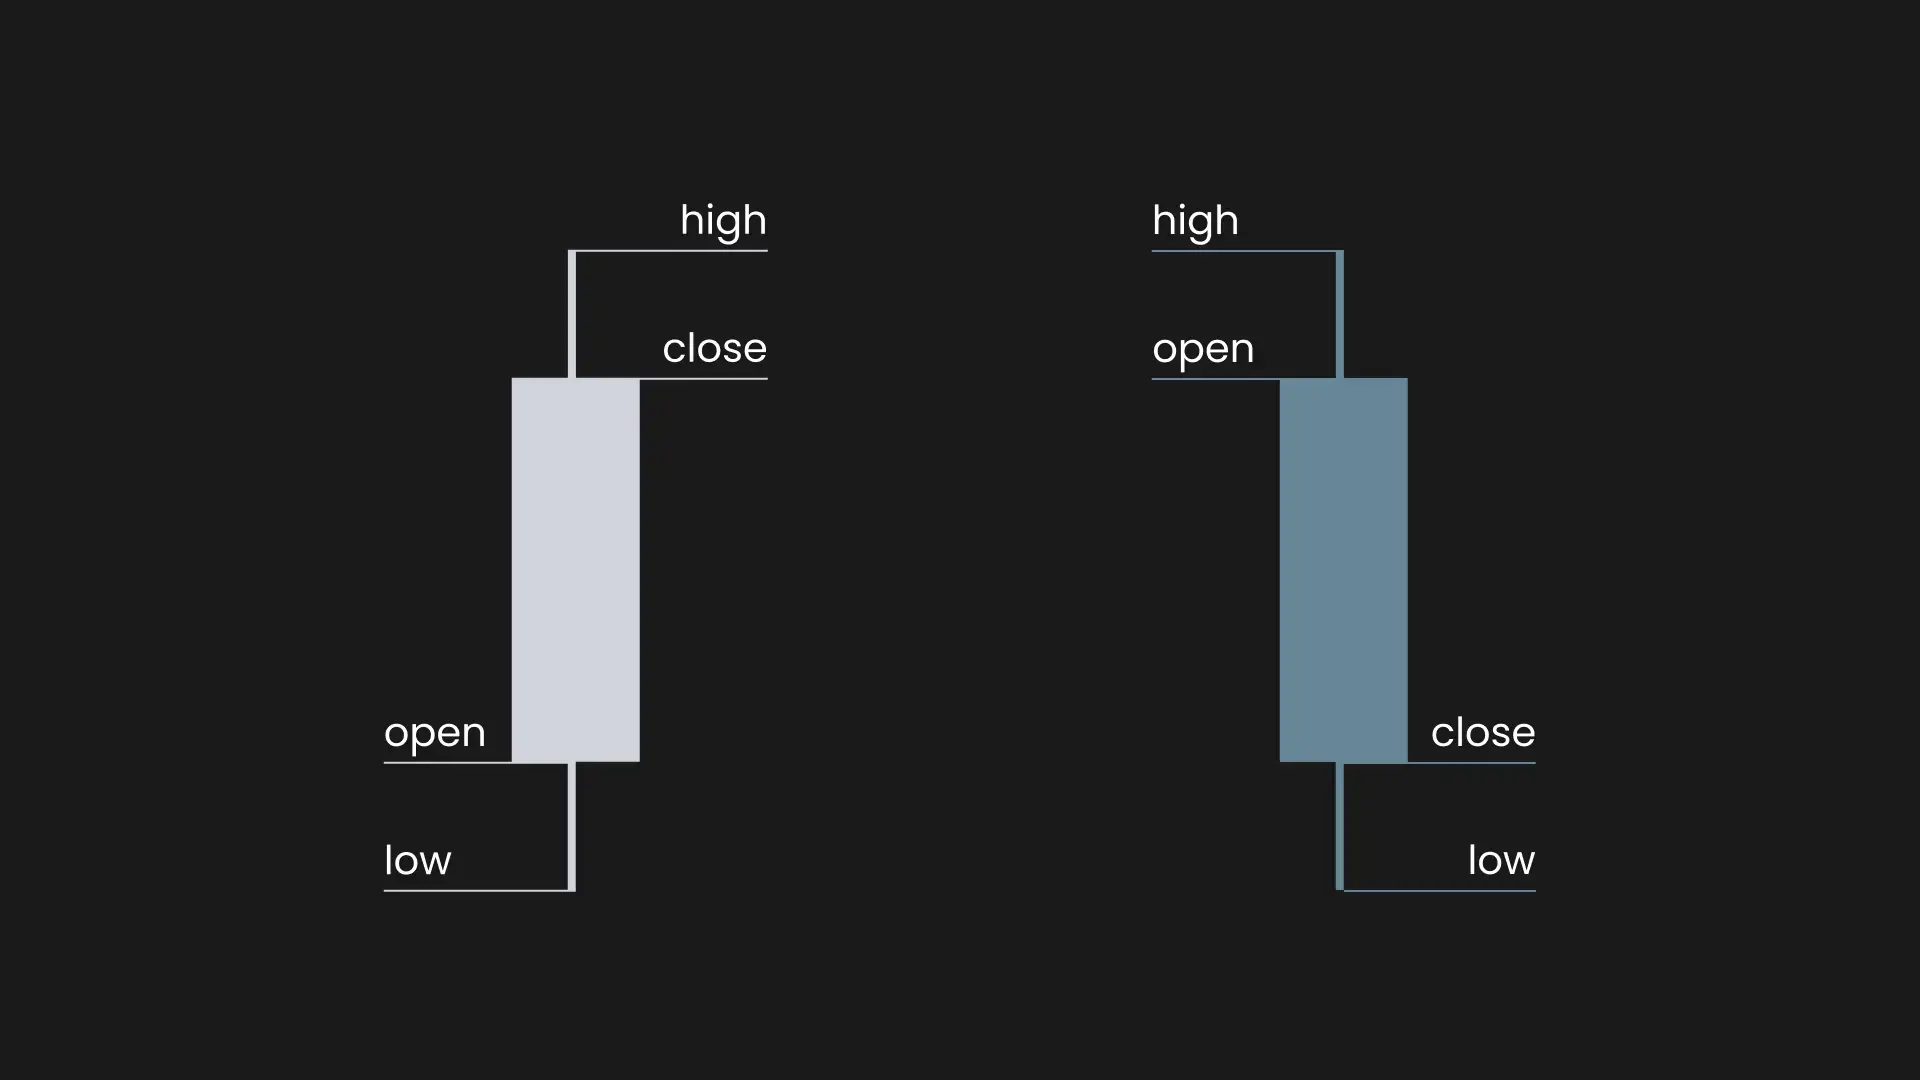
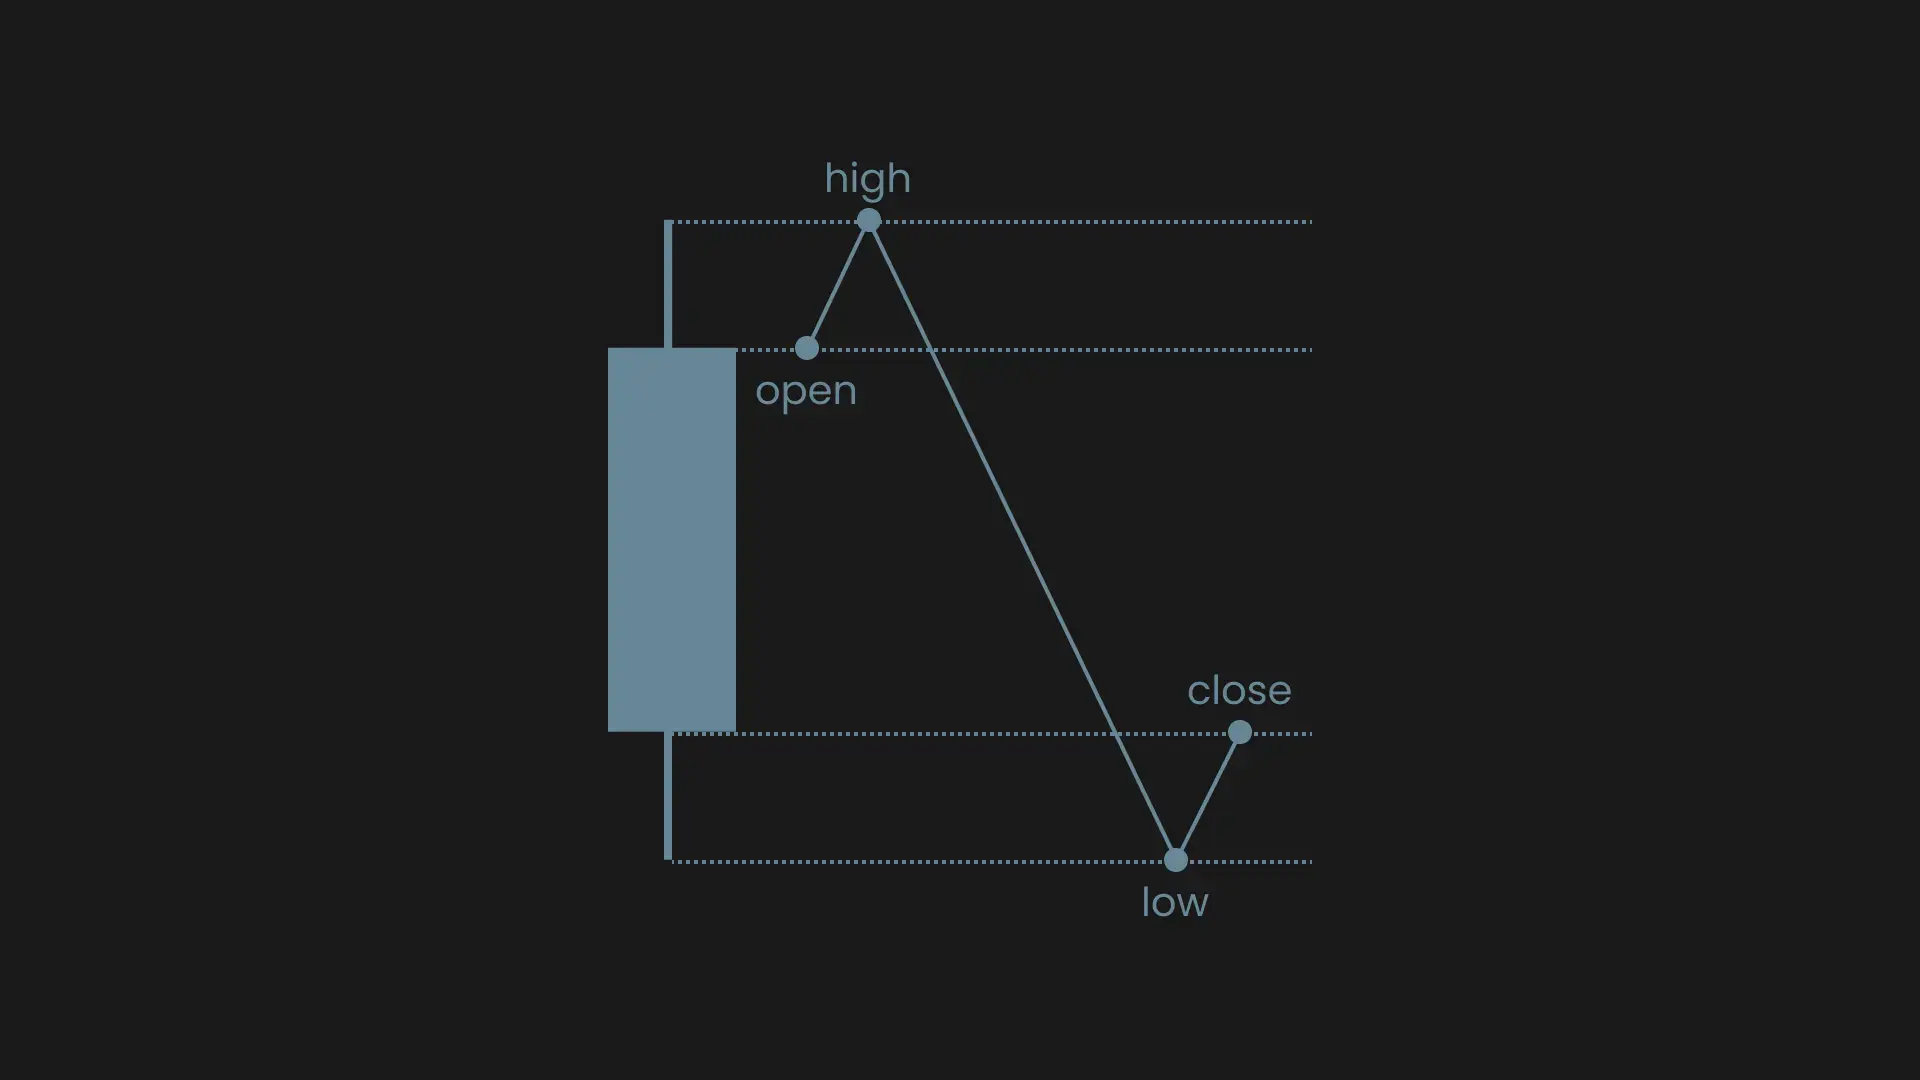
Open High Low Close (OHLC / OLHC)
A candlestick shows how price moved during a specific timeframe.
Price is fractal — each candle contains smaller moves from lower timeframes, e.g. a 1-hour candle is made up of 60 one-minute candles.
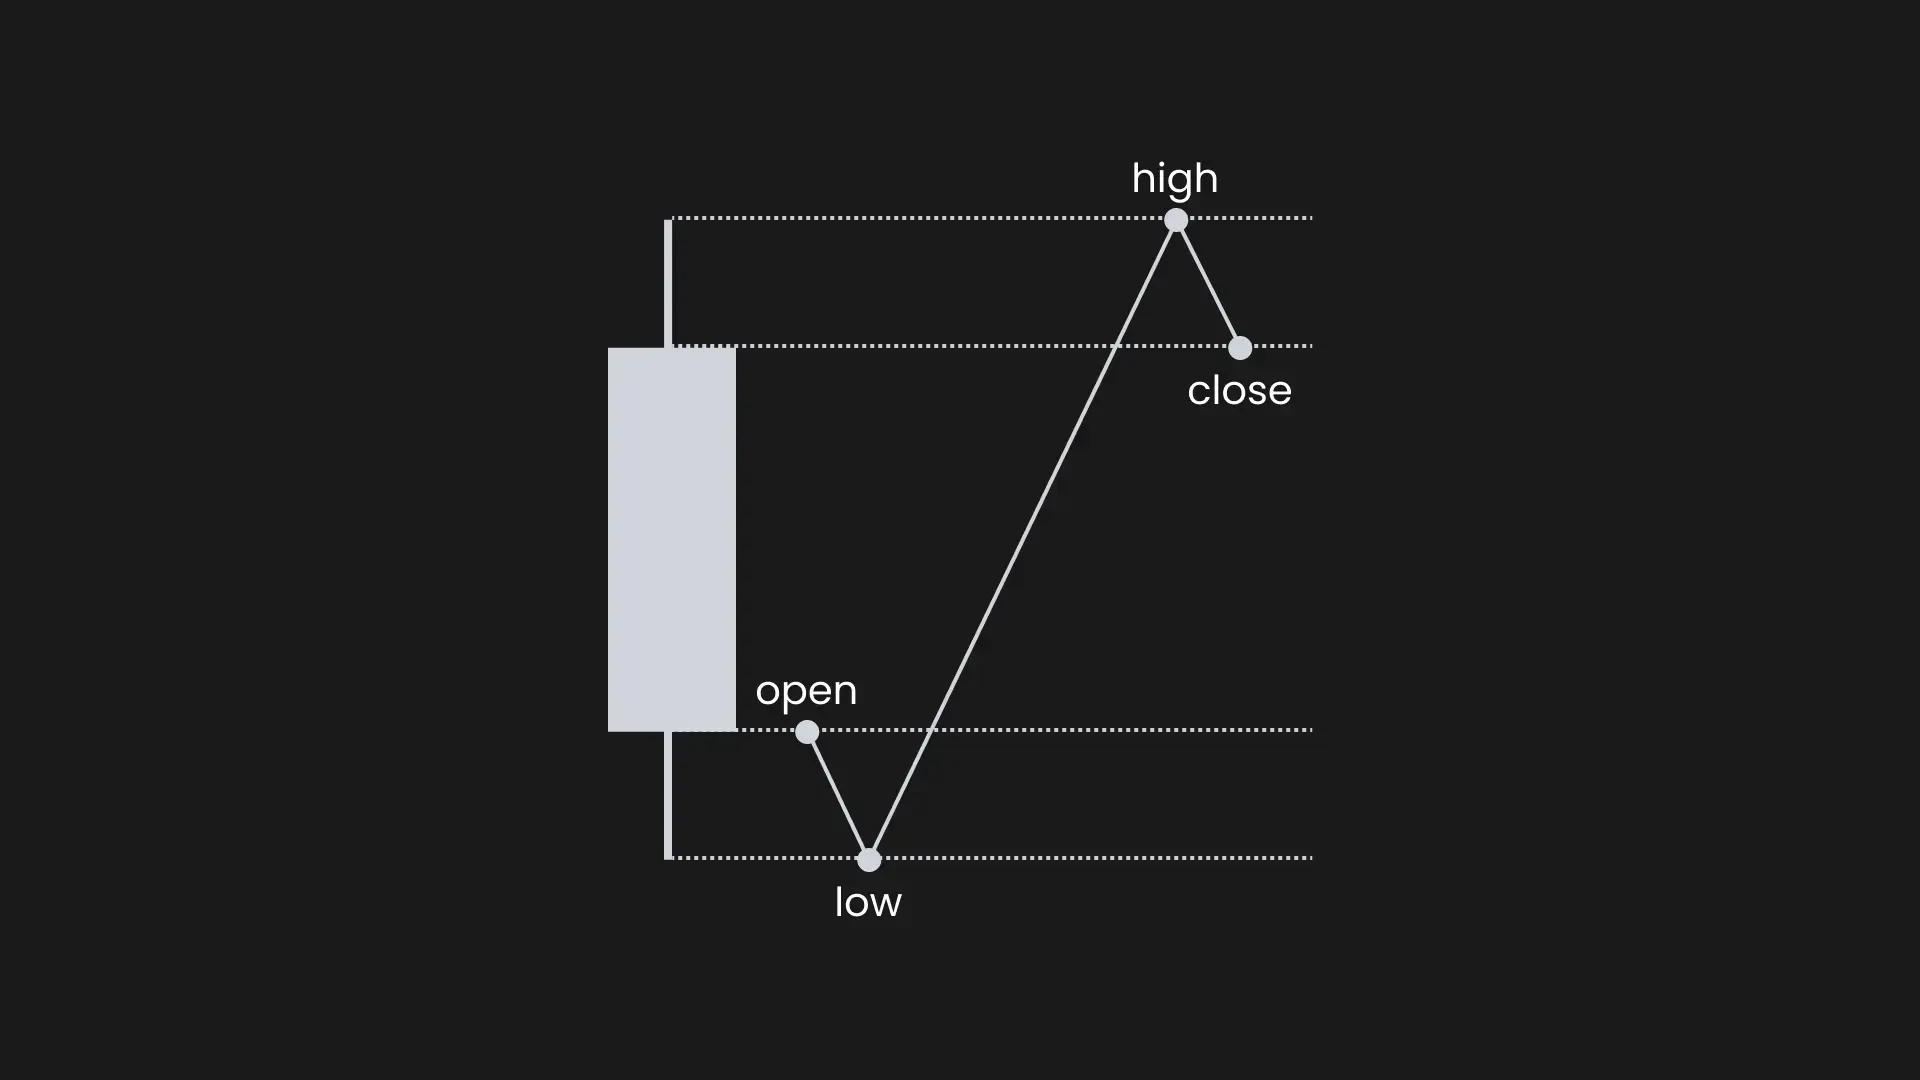
The body of the candle shows the open and a close.
The wicks show the high and low where the price went, but failed to close there.
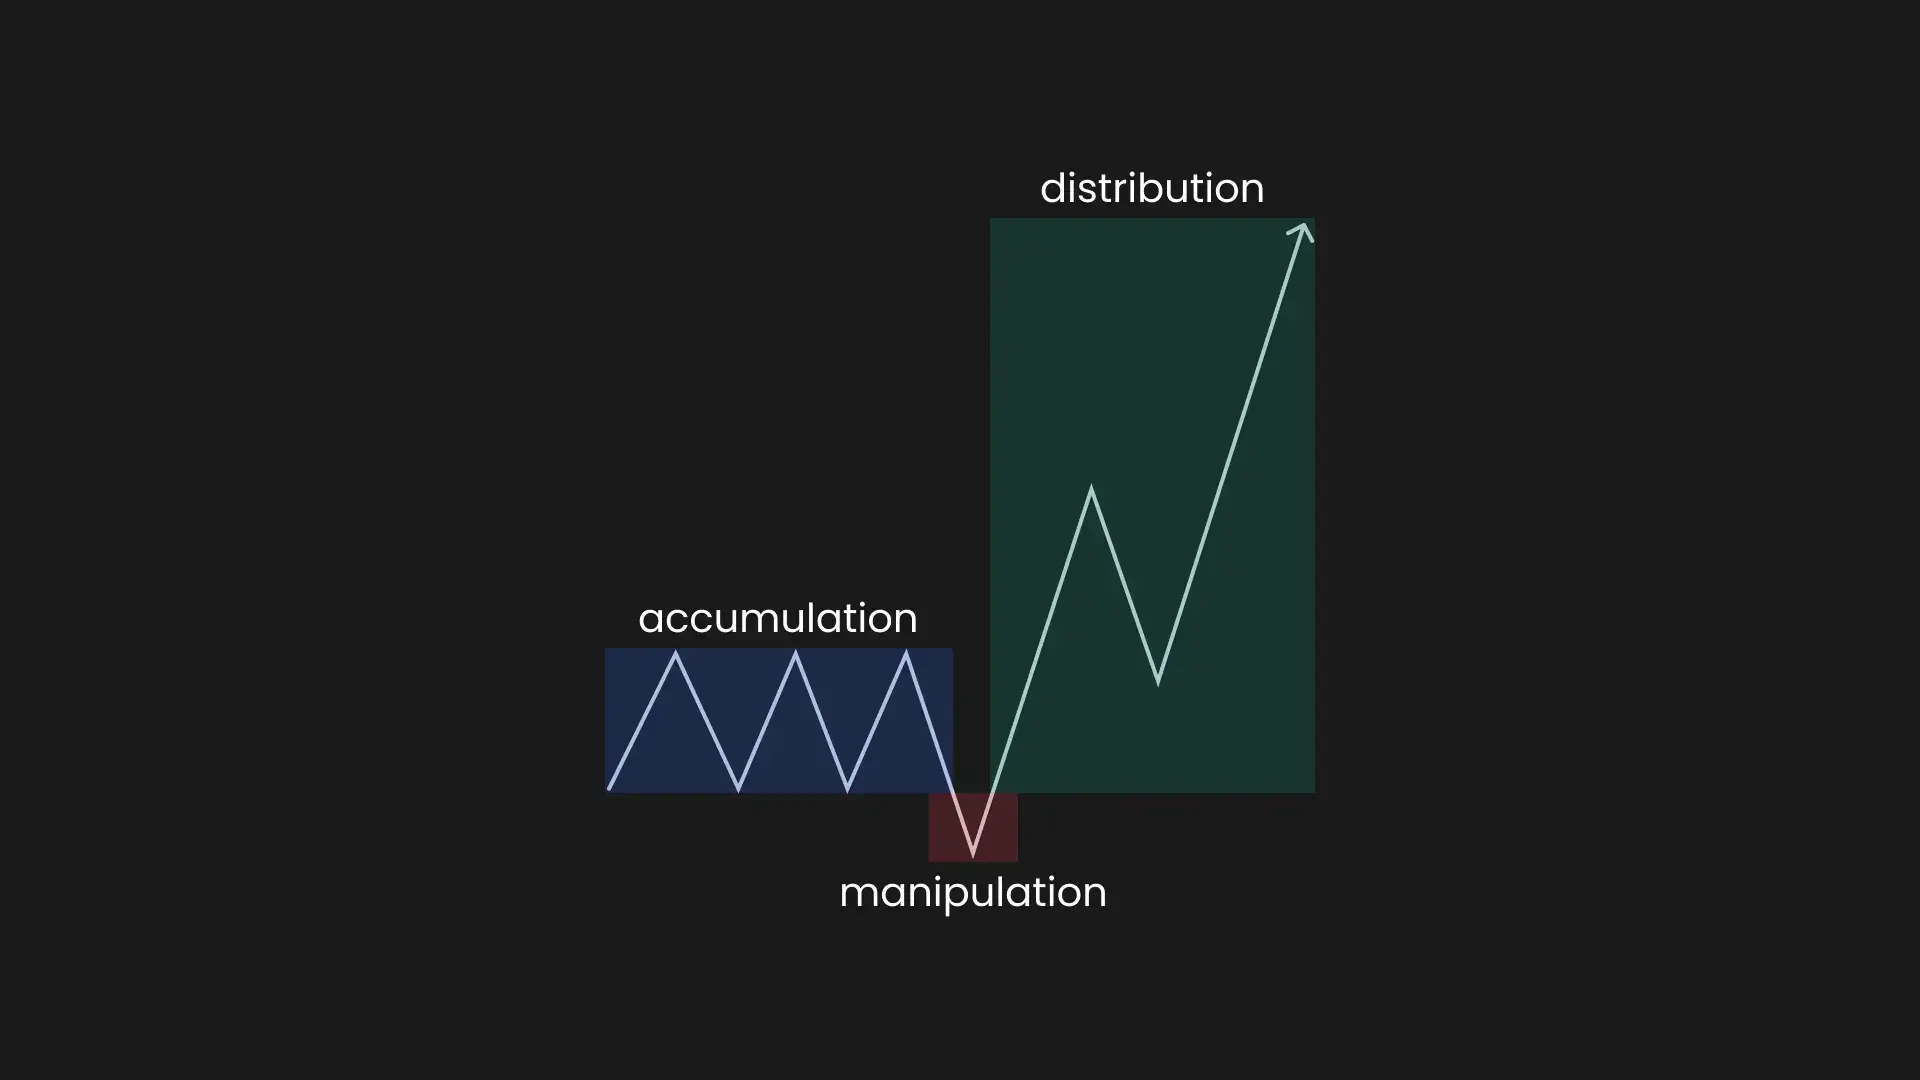
Power of 3 (AMD)
- Accumulation
Price will range, collecting orders. A lot of retail traders are anticipating a breakout.
- Manipulation
This is where the smart money causes price to drop lower or push higher.
This lures traders into buying or selling, creating liquidity that big players exploit to enter in the opposite direction.
One thing you need to be aware of is that price will always manipulate into a PD array or to sweep liquidity.
- Distribution
This phase distributes the liquidity gathered during accumulation and manipulation, with other traders joining the move and driving price further in its direction.